 |
 |
||||||||||||||||||||||||||||||||||||||||||||||||||||||||||||||||||||||||||||||||||||||||||||||||||||||||||||
|
|
|||||||||||||||||||||||||||||||||||||||||||||||||||||||||||||||||||||||||||||||||||||||||||||||||||||||||||||
|
|
|||||||||||||||||||||||||||||||||||||||||||||||||||||||||||||||||||||||||||||||||||||||||||||||||||||||||||||
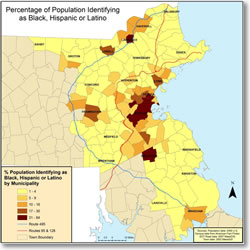
MAP: Percentage of Population Identifying as Black, Hispanic or Latino (Click on map to enlarge, click again to shrink) This map illustrates the percentage of population that identifies as Black, Hispanic, or Latino. Data is gathered at the municipality level using 2000 U.S. Census data taken from American Fact Finder.
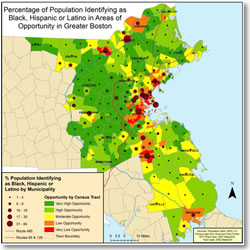
MAP: Percentage of Population Identifying as Black, Hispanic or Latino in Areas of Opportunity in Greater Boston (Click on map to enlarge, click again to shrink)
This map overlays the percentage greater Boston’s population that identifies as Black, Hispanic or Latino over the opportunity mapping data. The purpose of this map is to illustrate how the highest percentages of people of color (31-64%) are clustered in areas of very low or low opportunity census tracts, primarily in the communities of Boston, Lynn, Chelsea, Haverhill, Lawrence, Lowell, and Brockton.
1970s–Present: The impact of zoning
Fearful that the movement of jobs and population of to the suburbs could result in a large in-migration, municipalities responded by enacting stringent zoning ordinances. People became worried about the consequences of increased housing density, such as the costs of overcrowding schools and the loss of green spaces.
Suburban municipalities used and continue to use zoning regulations to control density, protect open space, and artificially inflate housing prices. Strict zoning restrictions have a disparate impact on African Americans and Latinos and in particular family households, because they limit affordability and the number of rental multifamily housing opportunities. Examples of strict zoning regulations include requirements for large minimum lots sizes, non-existent or minimal multi-family zoning allowances, and a greater leniency for age-restricted housing.
Segregation through zoning starting in the 1950s
During the 1950s, towns like Lincoln and Weston, threatened with a massive inrush for single family housing on their graceful stretches of farmland, were among the first to protect themselves in this way. The magnitude of the demand for any kind of housing raised the price of older housing stock and raised rents. This created a serious problem for persons outside the labor force in older communities such as Waltham. Little if any public housing was constructed in the communities adjacent to the road during this period. In this way, persons in the lower income group were squeezed out of the more affluent towns or filtered into the older dilapidated sections of the less affluent ones. The suburbs became increasingly homogenous with respect to income. (Rte 128: Boston’s Road to Segregation)
Today, the situation is very similar
Boston’s Metropolitan Area Planning Council (MAPC) projects that based on current zoning and development trends, more than 85% of new housing in developing suburbs in Metropolitan Boston in the coming decades will be large, expensive single-family houses on lots of one acre or more. MAPC concludes: “There will be a lack of modestly priced housing for young families, municipal employees, and minorities along I-495, even though this is where much of the region’s job growth will occur.” (MetroFuture, Trend Lines #3)