 |
 |
||||||||||||||||||||||||||||||||||||||||||||||||||||||||||||||||||||||||||||||||||||||||||||||||||||||||||||
|
|
|||||||||||||||||||||||||||||||||||||||||||||||||||||||||||||||||||||||||||||||||||||||||||||||||||||||||||||
|
|
|||||||||||||||||||||||||||||||||||||||||||||||||||||||||||||||||||||||||||||||||||||||||||||||||||||||||||||
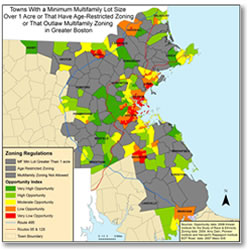
MAP: Towns with a minimum mutifamily lot size of more than 1 acre or that have age-restricted zoning or that outlaw multifamily zoning in Greater Boston
(Click on map to enlarge, click again to shrink)
Please see text at right for an explanation of the map.
1970s–Present: Minimum Lot Size Requirements
Many municipalities in Greater Boston have zoning laws that require large minimum lot sizes. Large minimum lot zoning is used to protect suburban towns from high density development and to preserve open space. While not overtly discriminatory, large minimum lot requirements have a disparate impact on the low-to-moderate income population. Large minimum lot zoning effectively restricts lower income residents from purchasing homes in the suburbs by artificially inflating housing prices. Ultimately this leads to a decrease in the supply of housing that is affordable to low- and moderate-income families.
Towns with a minimum mutifamily lot size of more than 1 acre or that have age-restricted zoning or that outlaw multifamily zoning in Greater Boston
The map at left includes towns that have an average minimum lot size requirement for multifamily zoning of more than 1 acre. Large minimum lot requirements make multifamily housing expensive and difficult to build. Thirty-four towns were identified as having average minimum lot requirements of more than 1 acre for multifamily housing. (Some of these towns were previously grayed out for either not allowing MF zoning or having age-restricted zoning).
After accounting for all 3 zoning regulations, the total number of towns considered to have strict zoning (with either no multifamily zoning, age-restricted zoning, or large average minimum lot requirements) is 75. Within these 75 towns, there are 228 census tracts:
- 46% are in very high opportunity areas (106),
- 34% are in high opportunity areas (77),
- 16% are in moderate opportunity areas (36),
- 4% are in low opportunity areas (9).
There are no areas of very low opportunity within the 75 towns with strict zoning.
After graying out the above 75 towns, 71 remained that did not have “strict zoning” according to our limited investigation. The map on the left shows the areas of opportunity that remain after the towns with strict zoning are grayed out. After removing the City of Boston, there are approximately 456 census tracts within these 71 towns.
- 33% of these tracts are either very low opportunity (77) or low opportunity (73),
- 24% are moderate (111),
- 21% are high (96),
- 22% are very high (99).
Who zones for large lots in Greater Boston?
- More than half of the municipalities in greater Boston (95 of 187) zone over 50% of their land area for lots sizes of one acre per home or greater,
- 14 municipalities within 50 miles of Boston zone more than 90% of their land for 2 acre lot sizes,
- 27 municipalities zone more than 90% of the land for at least one-acre lot sizes.
In addition, most communities require that between 50-90% of the lot size be buildable, contiguous land, meaning that the lot sizes generally have to be bigger than the requirements as they must subtract wetlands or steeply sloped land.
Connection between large lot size and cost of housing
Studies indicate that there is a positive correlation between large lot size and higher housing prices. An additional acre in minimum lot size was associated with an increase in median sales prices of homes in that locality by:
- 15.7% in 1987,
- 11.3% in 1995,
- 19.5% in 2001.
In Regulation and the Rise of Housing Prices in Greater Boston, Edward L. Glaeser, Jenny Schuetz and Bryce Ward found that as the minimum lot size increases by 1 acre, the share of affordable homes (a home for which an average resident of the region could afford to pay 30% of income) drops by 8%.
In addition, higher minimum lot sizes are strongly associated with lower numbers of permits and lower levels of housing development. As the average minimum lot size increased by one-quarter of an acre, there was:
- 10% fewer houses permitted in 1970,
- 9% fewer in 2000,
- and 10% fewer houses permitted between 1980 and 2002 (Glaeser/Schuetz).